In this entry we found some puzzling results. Ignore them! The variance had been screwed up by incorrect procedures on my part. As Hans pointed out, you have to use the method where two images with same exposure (and they must be of an evenly lit surface) are subtracted – the difference has twice the variance of each of the images. This method cancels various common features in the images – blemishes in the flat target as well as uneven response in the chip, and dust on the chip.
Taking a series of twin exposures from very dark to very bright of a white sheet of paper, and extracting a nice square from this, calculating its mean and variance as per above, we get the following result: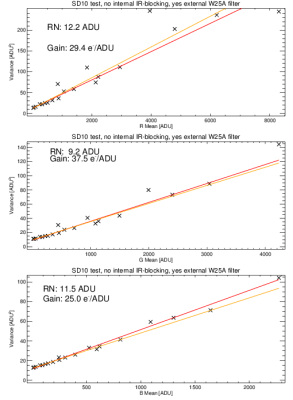
In each panel statistics for R G or B are shown. The readout noise RN is basically the intercept. The Gain is 1./(the slope) of the regression. Two sets of images had to be taken and it would seem the illumination was not even, hence the scatter. Nonlinearities set in for R G and B at various levels – the extent of the x-axis shows the data that are not obviously past the linearity point. So, despite the camera being advertised as 12-bit it has almost 13 bits. Sticking to the 12 seems a good idea – it is all that B can handle, for instance.
We used x3f_extract from proxel.se to extract the R G and B fields from the compressed format X3F files.
This paper by Hytti gets nearly the same as we have above – at least for the G band:

